
Most investing glossaries define a term and stop. Each entry here also says why the term matters to a decision, because a definition you cannot act on is trivia.
Business quality
Economic moat
A durable structural advantage that lets a company keep earning high returns while competitors try to take them away. Warren Buffett popularised the term. A moat is not a good product or a strong brand on its own; it is the reason those advantages survive competition for years rather than quarters.
Why it matters: The single best predictor of whether high returns persist.
Full guide: economic moats, the five types, the evidence a moat is real, and four fakes.
Network effect
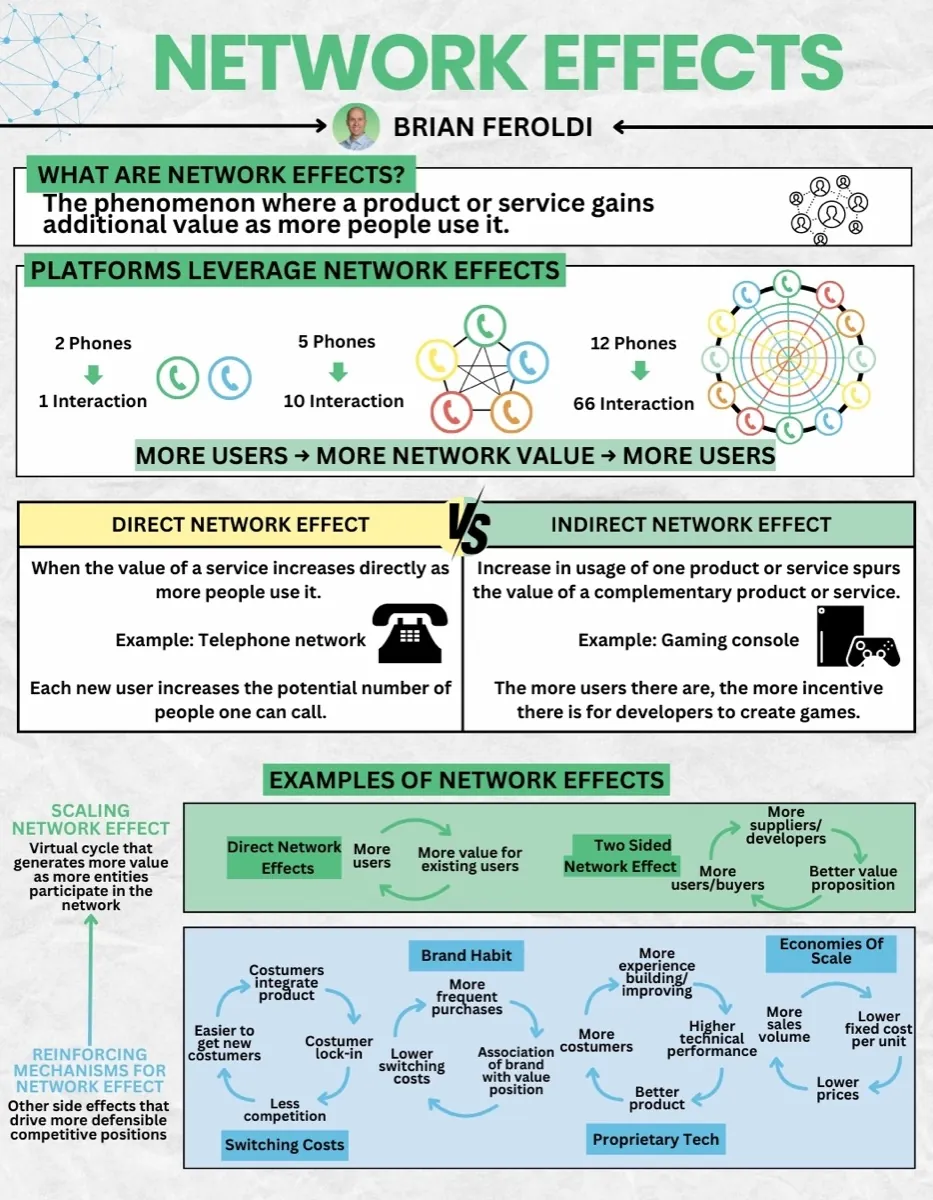
A moat where each additional user makes the product more valuable to every other user. Marketplaces, payment networks and social platforms are the classic examples. Network effects are powerful because they strengthen as the company grows, making late entrants progressively less able to compete on product alone.
Why it matters: Strengthens with scale rather than eroding.
Full guide: network effects, direct vs indirect, and how to tell a real one from a story.
Network effects explained: direct vs indirect, and the reinforcing mechanisms
Switching costs
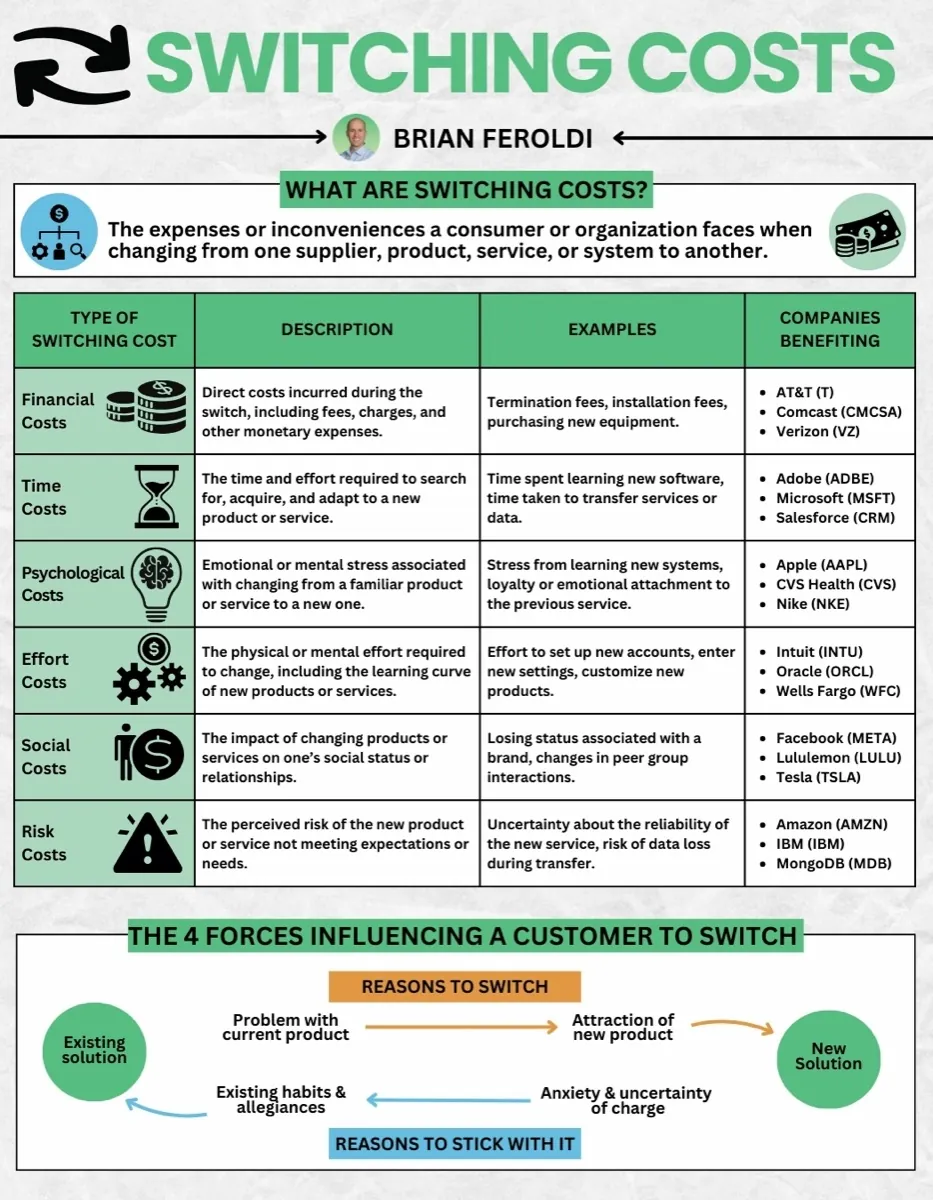
The money, time, risk or disruption a customer absorbs to move to a competitor. High switching costs let a company raise prices without losing customers, because leaving is more expensive than paying more. Enterprise software and banking relationships are typical examples.
Why it matters: Explains pricing power without a better product.
Full guide: switching costs, the six types and how they show up in a financial statement.
The six types of switching cost, with the companies that benefit from each
Pricing power
A company's ability to raise prices without materially losing customers. It is the most direct evidence a moat is real, because it shows customers have no acceptable substitute. Test it by looking at whether gross margins hold or expand through periods of cost inflation.
Why it matters: The cleanest observable proof of a moat.
Full guide: Pricing power, how to see it in gross margin, and where the test misleads.
Cost advantage
A moat where a company produces at a structurally lower cost than competitors, through scale, process, location or access to cheaper inputs. It allows the company either to undercut rivals on price or to earn higher margins at the same price.
Why it matters: Durable only if the source cannot be copied.
Full guide: Cost advantage, the four durable sources, and why cheap is not the same as low-cost.
Lifecycle and growth
Company lifecycle
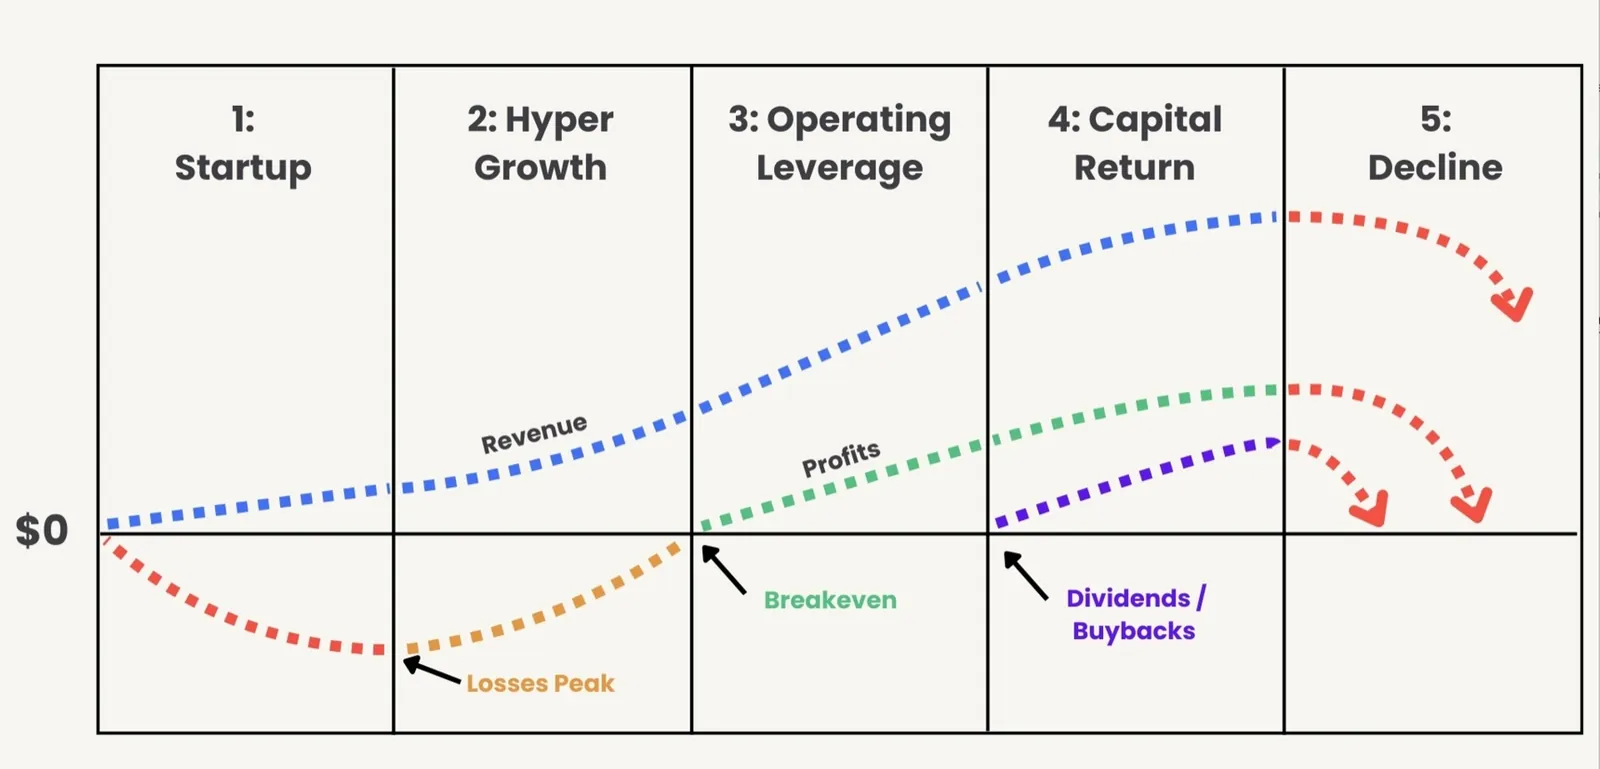
The five phases a business moves through: startup, hyper growth, operating leverage, capital return and decline. The metrics that matter change completely at each one, which is why judging a hyper-growth company on profitability, or a capital-return company on revenue growth, produces confident but wrong conclusions.
Why it matters: Determines which metrics are even relevant.
Full guide: the 5 phases of a company's lifecycle, what to measure and how to value at each one.
The five phases charted against revenue and profit
CAGR
Compound annual growth rate: the constant yearly rate that would take a starting value to an ending value over a period. It smooths out volatile individual years into one comparable number, which makes it useful for comparing growth across companies and misleading if the underlying path was erratic.
Why it matters: Comparable growth across different businesses.
Full guide: CAGR, why averaging the years gives the wrong answer, and the volatility it deliberately hides.
Operating leverage
The degree to which a company's fixed costs cause profits to grow faster than revenue. High operating leverage means each extra dollar of sales drops disproportionately to the bottom line, and it works just as violently in reverse when revenue falls.
Why it matters: Explains why margins expand as revenue scales.
Full guide: operating leverage, why profits grow faster than sales, and how it reverses.
Rule of 40
A rough test for software companies: revenue growth rate plus profit margin should exceed 40%. It captures the trade-off between growing fast and being profitable, allowing a company to justify low margins if growth is high, or slow growth if margins are strong.
Why it matters: One number balancing growth against profitability.
Full guide: the Rule of 40, which margin to use, what a good score looks like, and where the rule stops working.
Check any company's phase for free
Phase Check reads the financials for any of 10,000+ global stocks and places it on the five-phase curve, then names the metric to watch and the valuation method that fits that phase.
Try Phase Check freeNo credit card. One check without an account, unlimited with a free one.
Profitability and returns
ROIC
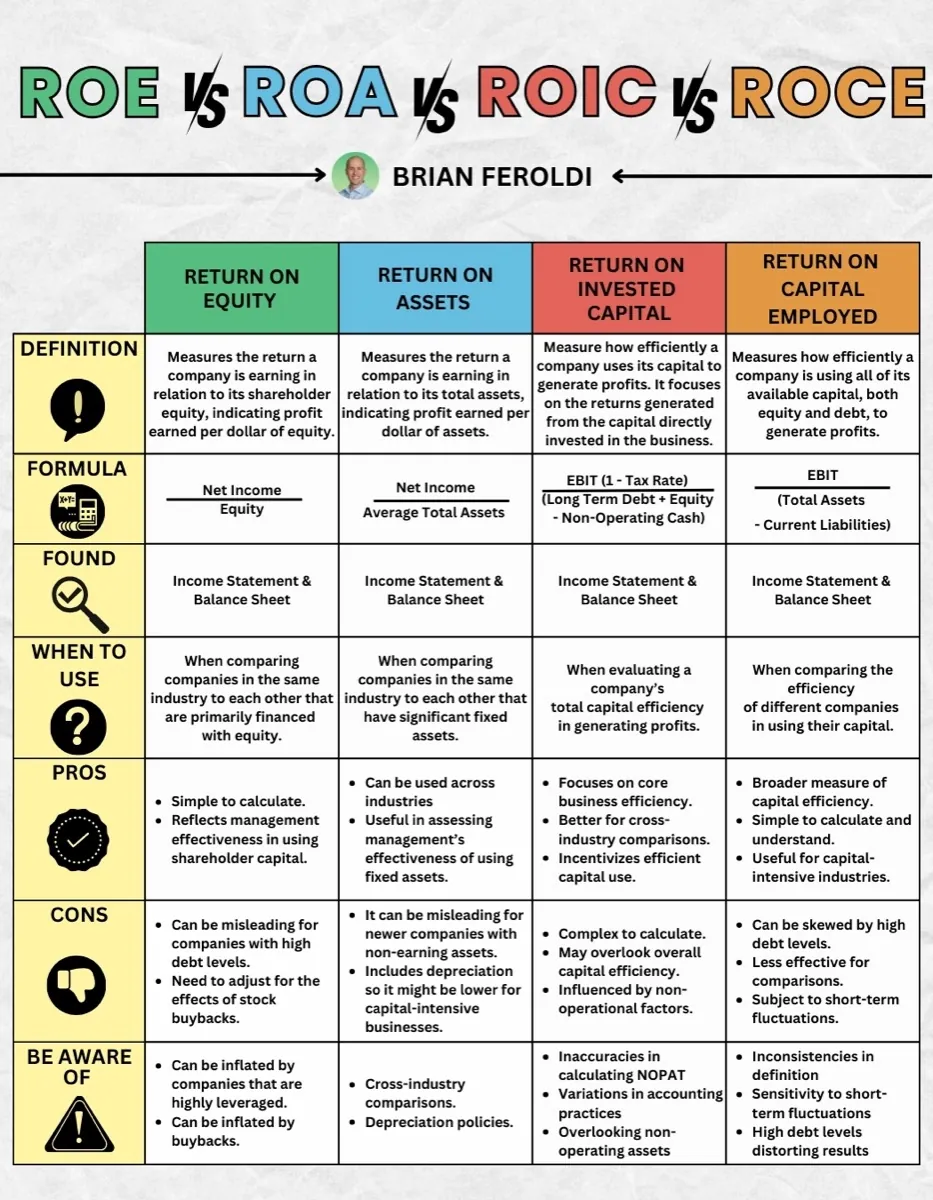
Return on invested capital: operating profit after tax divided by the capital the business employs. It answers the central question of business quality, which is how much profit the company generates per dollar invested. A ROIC durably above the cost of capital is what creating value actually means.
Why it matters: The clearest single measure of business quality.
Full guide: ROIC, how to calculate it, what counts as good, and four ways it misleads.
ROE vs ROA vs ROIC vs ROCE: formulas, when to use each, and what distorts them
Free cash flow
The cash left after a company pays operating expenses and the capital expenditure needed to maintain and grow the business. Unlike net income, it is difficult to manipulate with accounting choices, which is why many investors treat it as the truest measure of earnings.
Why it matters: Harder to manipulate than reported profit.
Full guide: free cash flow, how to calculate it and where it gets flattered.
Gross margin
Revenue minus the direct cost of producing goods or services, expressed as a percentage of revenue. It shows how much a company keeps from each sale before overheads, and it is often the first place a weakening competitive position becomes visible.
Why it matters: An early warning signal for eroding advantage.
Full guide: gross margin, why it moves years before net income does.
Owner earnings
Buffett's preferred measure of profit: reported earnings plus depreciation and amortisation, minus the capital spending required to maintain the business's competitive position. It aims to capture the cash an owner could actually withdraw each year without weakening the company.
Why it matters: What an owner could genuinely take out.
Full guide: owner earnings, what Buffett was objecting to, and why maintenance capex is the hard part.
Valuation
Intrinsic value
What a business is actually worth, based on the cash it will generate over its remaining life discounted back to today. It is an estimate, not a fact, and it depends entirely on assumptions about growth, margins and duration. Two careful analysts will reach different numbers.
Why it matters: The number price should be judged against.
Full guide: intrinsic value, how it is estimated and why careful analysts disagree.
Discounted cash flow
A valuation method that projects a company's future free cash flows and discounts them to present value. DCF is theoretically the most correct approach and practically the most sensitive to assumptions, since small changes in growth or discount rate produce very different answers.
Why it matters: Rigorous in theory, fragile in practice.
Full guide: Discounted cash flow, the three inputs, and why the terminal value is most of the answer.
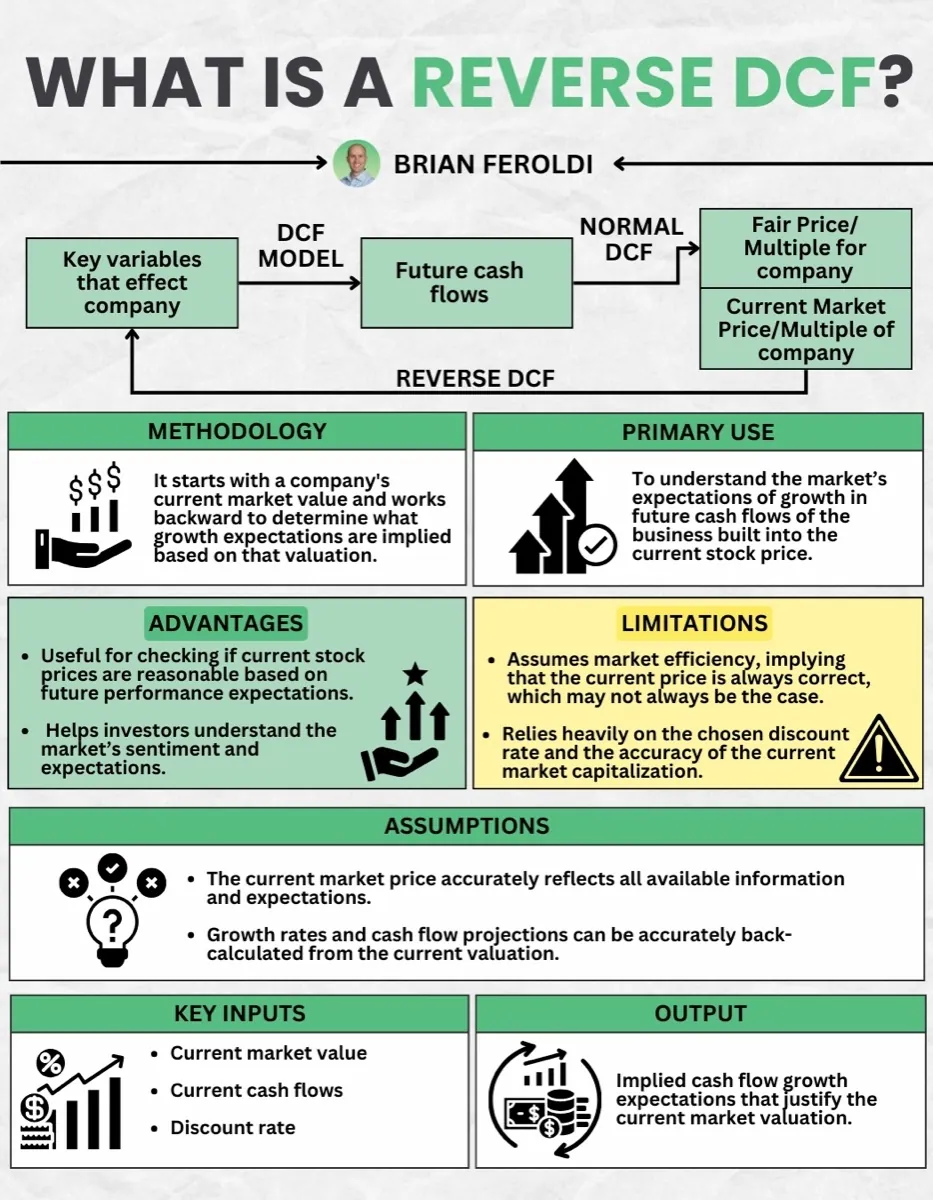
Reverse DCF
A DCF run backwards. Instead of estimating a fair value, you take the current share price and solve for the growth rate the market must already be expecting. It converts an unanswerable question into a checkable one: are those expectations reasonable?
Why it matters: Turns valuation into a judgement you can actually make.
Full guide: reverse DCF, what growth the current price already assumes.
How a reverse DCF works, what it assumes, and where it breaks
P/E ratio
Share price divided by earnings per share, showing what investors pay for each dollar of profit. It is the most widely used multiple and the most widely misused, because it is meaningless without context on growth, business quality and where the company sits in its lifecycle.
Why it matters: Useful only alongside growth and quality.
Full guide: the P/E ratio, trailing versus forward, and four situations where it gives a confidently wrong answer.
Margin of safety
The gap between a company's estimated intrinsic value and the price you pay. Benjamin Graham's core idea: because every valuation rests on assumptions that may be wrong, buying well below your estimate protects you from your own errors rather than from the market's.
Why it matters: Protection against your own analytical mistakes.
Full guide: margin of safety, how wide it should be, and why cheap is not the same as safe.
TAM
Total addressable market: the full revenue opportunity if a company captured all demand for its product. Useful for sizing ambition in young companies, easily abused, since a large TAM says nothing about whether this particular company can win a meaningful share of it.
Why it matters: Sizes the opportunity, not the odds.
Full guide: TAM, SAM and SOM, why the headline market-size number is nearly always the wrong one.
EV/EBITDA
Enterprise value divided by earnings before interest, tax, depreciation and amortisation. Because enterprise value includes debt, it compares companies with different capital structures more fairly than P/E. It also flatters businesses with heavy real capital spending, since it excludes depreciation.
Why it matters: Fairer across different debt levels.
Full guide: EV/EBITDA, why it beats P/E for comparison, and the cost it refuses to count.
Dividends
Dividend yield
Annual dividends per share divided by share price. An unusually high yield is more often a warning than a bargain, because it usually means the price has fallen on concerns the market has about the business, not that the company has become generous.
Why it matters: High yields usually signal risk, not value.
Full guide: dividend yield, why a high yield is usually a warning, and the checks that separate income from a trap.
Payout ratio
The share of earnings or free cash flow paid out as dividends. A low ratio suggests room to keep paying and raising through a downturn. A ratio near or above 100% means the dividend depends on the business not deteriorating.
Why it matters: The clearest test of whether a dividend is safe.
Full guide: the payout ratio, earnings first then cash, what counts as safe, and why cyclicals need far more headroom.
Dividend safety
An assessment of how likely a company is to sustain and grow its dividend. It depends on the payout ratio, the stability of cash flows, the amount of debt and how discretionary the spending is. Cyclical businesses carry more dividend risk at any given payout level.
Why it matters: Yield means nothing if the payment stops.
Full guide: How to tell if a dividend is safe, the payout ratio checks that separate income from a cut waiting to happen.
Risk
Dilution
The reduction in existing shareholders' ownership when a company issues new shares, through capital raises or stock-based compensation. A business can grow revenue and profit while per-share value stagnates if the share count grows just as quickly.
Why it matters: Growth per share is what you actually own.
Full guide: Dilution, how to read the diluted share count, and the buyback that is not one.
Interest coverage
Operating profit divided by interest expense, showing how many times over a company can pay the interest on its debt. Low coverage means modest declines in profit can threaten solvency, which is why it matters far more for cyclical businesses.
Why it matters: How much room the balance sheet leaves for error.
Full guide: interest coverage, why the total debt figure misleads, and what the levels actually mean.
Customer concentration
The share of revenue coming from a small number of customers. When one client is a large share of sales, losing them is an existential event rather than a setback, and it usually hands that customer significant pricing leverage.
Why it matters: One lost contract can break the thesis.
Full guide: Customer concentration, where the 10-K discloses it, and when depending on few customers is fine.
Financial statements
Income statement
The statement showing revenue, costs and profit over a period. It answers whether the company made money, using accounting rules that spread costs and recognise revenue by judgement rather than by cash movement. That judgement is why it should always be read alongside the cash flow statement.
Why it matters: Profit, but assembled from estimates.
Full guide: How to read an income statement, the five lines that carry the information, top to bottom.
Balance sheet
A snapshot of what a company owns, owes and what is left for shareholders at one moment. Assets equal liabilities plus equity, always. It answers whether the company can survive a bad year, which the income statement cannot tell you.
Why it matters: Where solvency is either visible or hidden.
Full guide: How to read a balance sheet, what the company owns, what it owes, and what is left over.
Working capital
Current assets minus current liabilities: the short-term cash cycle of the business. Rising working capital consumes cash even in a growing company, which is why fast-growing businesses sometimes run short of money while reporting healthy profits.
Why it matters: Growth can consume cash faster than it earns it.
Full guide: working capital, three ways to calculate it, and why negative working capital is often excellent.
Goodwill
The premium paid above the fair value of a company's assets in an acquisition. Large goodwill balances mean the company has bought growth rather than built it. Write-downs of goodwill are an admission that the price paid was too high.
Why it matters: A record of what management paid for growth.
Full guide: Goodwill, why impairment always arrives late, and the ratio worth checking.
Deferred revenue
Cash collected for products or services not yet delivered, recorded as a liability until earned. For subscription businesses it is a genuinely useful signal, because growing deferred revenue means customers are committing ahead of delivery.
Why it matters: Customers paying in advance is a quality signal.
Full guide: Deferred revenue, why this liability is good news, and what a falling balance warns about.
Market mechanics
Market capitalisation
Share price multiplied by shares outstanding: what the market says the equity is worth. It is the honest starting point for valuation, since price alone tells you nothing without knowing how many shares exist.
Why it matters: Price is meaningless without share count.
Full guide: market capitalization, the size categories, and why share price on its own means nothing.
Enterprise value
Market capitalisation plus debt minus cash: what it would cost to buy the whole business outright. It is the fairer basis for comparing companies with different debt levels, because it counts what an acquirer would actually assume.
Why it matters: Compares businesses, not capital structures.
Full guide: enterprise value, where it changes the answer most, and the problem with EV/EBITDA.
Float
The shares actually available for public trading, excluding those held by insiders and locked-up holders. A small float means thinner liquidity and sharper price moves, which is why small-float stocks can swing violently on modest volume.
Why it matters: Explains volatility that has nothing to do with the business.
Full guide: Float, why low float makes prices violent, and what a lockup expiry does.
Short interest
The proportion of a company's float sold short by investors betting the price will fall. High short interest signals that informed money disagrees with the current price, and it also creates the conditions for a violent rally if that view is wrong.
Why it matters: A visible measure of who is betting against you.
Full guide: Short interest, why heavy shorting is not a buy signal, and how to use it as a prompt.
Insider ownership
The share of a company owned by its executives and directors. Meaningful ownership aligns their outcomes with yours, though very high ownership can also entrench management against accountability. Watch the direction of buying and selling more than the level.
Why it matters: Alignment, when they own what you own.
Full guide: Insider ownership, why one buy outweighs ten sells, and how to read a Form 4.
Investor behaviour
Circle of competence
The set of businesses you understand well enough to judge. Buffett's point was never that the circle should be large, only that you should know precisely where its edge is. Most permanent losses come from acting confidently just outside it.
Why it matters: Knowing the edge matters more than the size.
Full guide: circle of competence, the three questions that test the boundary, and what to do at the edge.
Mr Market
Benjamin Graham's metaphor for the stock market as a manic business partner who quotes you a price every day, sometimes euphoric and sometimes despairing. You are free to ignore him. The price he offers is information about his mood, not about the business.
Why it matters: Price is an offer, not a verdict.
Full guide: Mr Market, what Graham's parable changes, and the way it gets misused.
Position sizing
How much of a portfolio to allocate to a single holding. It is where conviction meets risk management: a position too small to matter cannot help you, and one too large means a single mistaken thesis can undo years of good decisions.
Why it matters: Where good analysis is most often undone.
Full guide: Position sizing, sizing from the downside, and what to do with a winner that got large.
Time horizon
How long you intend to hold. It determines which questions matter: quarterly momentum for months, competitive durability for years. Most disagreements about whether a stock is a good buy are really disagreements about horizon.
Why it matters: Changes which analysis is even relevant.
Full guide: Time horizon, the one edge an individual has, and the ways it gets given away.
Where these fit together
These terms are not a list to memorise. They are the questions a complete analysis works through in order: what the business does, where it sits in its lifecycle, whether its advantage is durable, how profitably it grows, what could break it, and what it is worth. Answer those in sequence and you have a thesis rather than a hunch.